
Why Some Airbnb Listings Win on Revenue, Not Just Price
- johanna2452
- Mar 30
- 4 min read

Understanding why some Airbnb listings perform better than others is not about aesthetics alone—it’s about how effectively a property converts demand into revenue.
Across today’s short-term rental markets, the performance gap between top and average listings continues to widen. And it’s rarely explained by location alone.
The real drivers are:
Airbnb pricing strategy
Market positioning
Revenue management execution
One of the most common mistakes? Owners optimize for ADR (average daily rate) instead of RevPAR (revenue per available rental night)—and misinterpret performance using outdated benchmarks.
The Core Metric Mistake: Why ADR Is Misleading
Most hosts focus on increasing their nightly rate.
But Airbnb revenue vs price is not a linear relationship.
ADR tells you what you charged.It does not tell you how well your listing performed.
A simple example:
$400/night at 40% occupancy = underperformance
$300/night at 70% occupancy = stronger revenue outcome
This is where most short-term rental pricing strategies fail.
Why RevPAR/RevPAN Matters More
If you want to improve Airbnb revenue optimization, you need to focus on RevPAR.
RevPAR = ADR × Occupancy
It measures:
pricing effectiveness
demand capture
overall listing performance
This is the metric professional operators use when evaluating short-term rental performance metrics.
Across multiple markets, we consistently see:
High ADR listings underperform due to low occupancy
Optimized pricing listings outperform due to stronger booking volume
Top-performing Airbnb listings often generate 20–40% higher RevPAR—even when pricing is similar.
Practical takeaway:
Stop asking, “Can I raise my nightly rate?”
Start asking, “Am I maximizing revenue per available night?”
How Revenue Is Actually Generated in STR Markets
Revenue in short-term rentals is driven by timing, demand, and pricing alignment—not static pricing.
The Balance Between Price and Occupancy
Every market has a demand curve.
When pricing is too high:
Occupancy drops
Calendar gaps increase
Total revenue declines
When pricing is optimized:
More nights are booked
Revenue stabilizes
Performance improves
This is the foundation of a strong Airbnb pricing vs occupancy strategy.
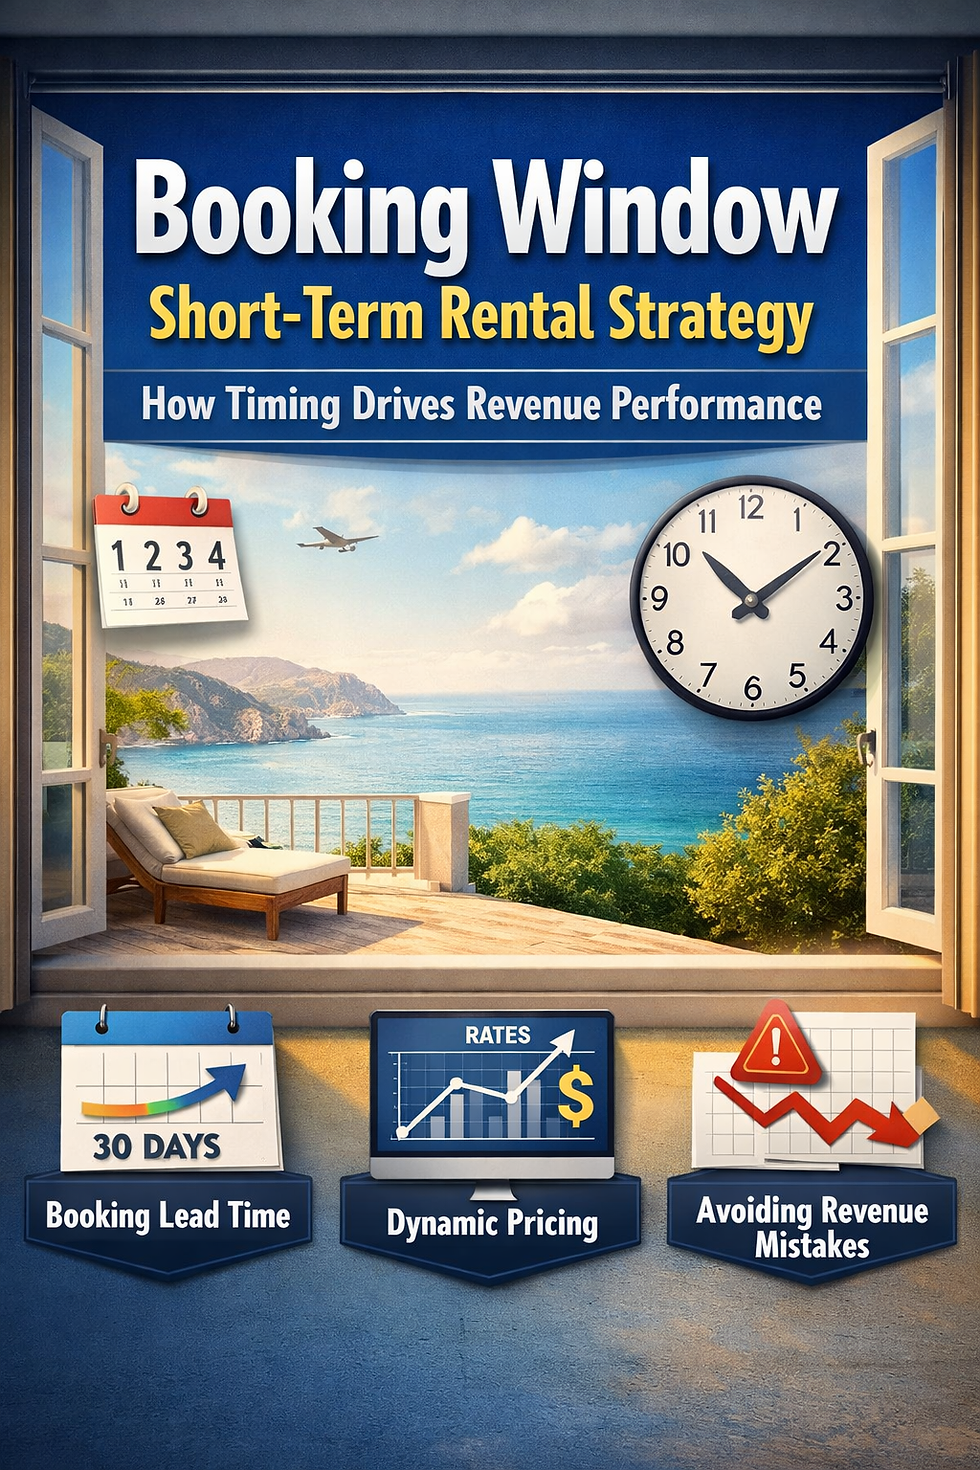
Booking Window Compression
One of the biggest shifts in the market is booking window compression.
Average booking window ≈ 55 days
~30% of bookings occur within 7 days
This changes everything about Airbnb pricing strategy.
Top-performing listings:
Adjust pricing dynamically
Capture last-minute demand
Optimize orphan nights
Underperforming listings:
Rely on static pricing
Discount too early
Miss demand spikes
This is where most revenue is lost.
Why Year-Over-Year Revenue Comparisons Often Mislead Owners?
Many owners evaluate performance by comparing this year to last year.
This is one of the biggest analytical mistakes in shoa rt-term rental investment strategy.
Supply Growth Changes the Game
STR supply has grown significantly in most markets.
Result:
More competition
Fragmented demand
Increased pricing pressure
Maintaining the same revenue is often a win.
Growth now requires outperforming your comp set—not your past performance.
Demand Is Not Static
Guest behavior is changing:
more last-minute bookings
higher sensitivity to value
stronger preference for unique experiences
A listing that performed well last year may underperform today without adaptation.
Better benchmark:
comp set performance
market share
booking pace vs competitors
What High-Performing Airbnb Listings Do Differently
The difference between average and top-performing listings is operational discipline.
Dynamic Pricing and Comp Set Strategy
Top performers:
Use tools like Price Labs, Wheelhouse, Beyond Pricing, and AirDNA - are there different tools we can highlight? These are mentioned in most of our content.
Continuously adjust pricing based on demand signals
Monitor a defined comp set
Dynamic pricing alone can increase revenue 15–30% when implemented correctly.
Conversion Rate Optimization
Revenue is not just about traffic—it’s about conversion.
Top listings:
Have professional photography
Clearly communicate value
Highlight unique features
Even a small increase in conversion rate (e.g., 2% → 3%) can significantly impact revenue.
Market Forces Driving Performance Gaps
The short-term rental market is not declining—it is becoming more competitive.
Supply vs Demand Imbalance
Supply is growing faster than demand in many regions.
Result:
Supply is growing faster than demand
Competition is increasing
Experience-Driven Demand
Guests are prioritizing:
Design-forward properties
Unique amenities
Strong reviews
Listings that fail to evolve are losing visibility and bookings.
Operational Decisions That Impact Revenue Performance
Performance is ultimately driven by execution.
Pricing Systems and Automation
At the highest level, Airbnb revenue optimization is a system—not a tactic.
Top operators:
Review pricing weekly
Monitor booking pace
Adjust based on demand signals
Optimize minimum stays and gaps
Consistency in Execution
Revenue is not a one-time decision—it’s ongoing.
Consistent actions include:
Weekly pricing reviews
Monitoring booking pace
Adjusting based on demand signals
Key Takeaways
High ADR does not equal high revenue
RevPAR is the most important performance metric
Pricing strategy must align with booking windows
Year-over-year comparisons are unreliable
Dynamic pricing + positioning drive results
Conversion and timing determine revenue
Conclusion: Performance Is a System, Not a Metric
The reason some Airbnb listings win on revenue, not just price, comes down to strategy.
Top-performing operators:
Optimize for RevPAR
Align pricing with demand
Execute consistently
Underperforming listings:
Chase higher prices
React too early
Ignore market signals
If you want to improve your short-term rental revenue strategy, you need to evaluate performance against your market—not your assumptions.
If you're unsure whether your pricing, positioning, and performance are aligned with your market, request a Revenue Audit. We’ll show you exactly where your listing stands—and where the opportunities are.


Comments